
How chemical plants increase capacity without new equipment: debottlenecking the time between batch stages
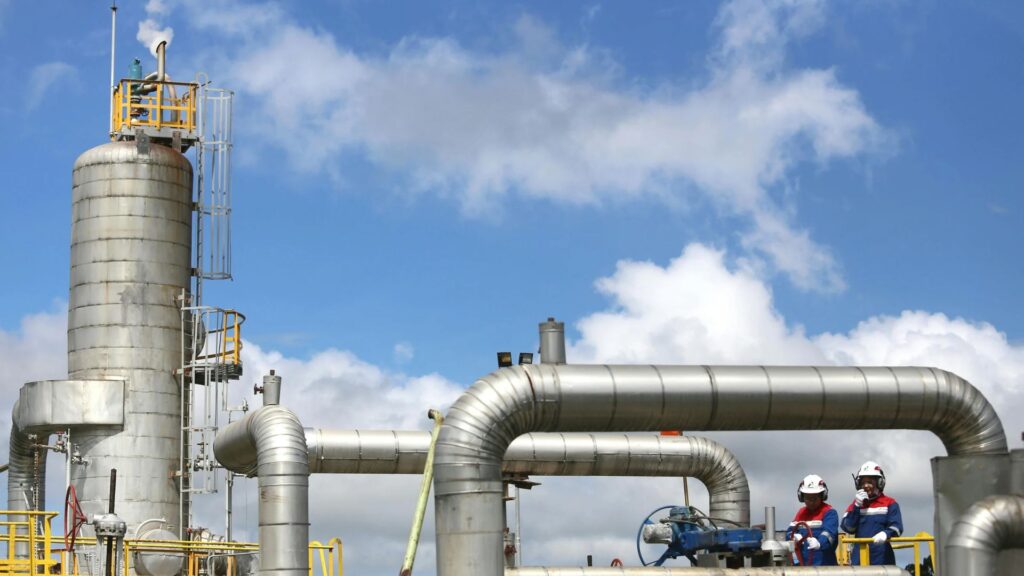
Key Takeaways Output from existing assets is now the central lever: with global chemical production growth forecast at around 2 percent a year and overcapacity in many value chains, debottlenecking existing plants is the capacity lever batch producers still control. Most lost throughput sits between stages: batch cycle time is extended by filtration queues, longer-than-planned drying and holds before release, more than by the reactor itself. Delays start upstream of where they appear: a slow dryer often reflects conditions created earlier, during filtration or washing. Undocumented operator fixes keep batches on track: experienced operators, planners and supervisors make adjustments that never reach the batch record, and the coming wave of retirements puts that knowledge at risk. NaturalAI™ connects the stages to one process record: production, quality and maintenance see the same batch history and know who owns each exception, without replacing control systems or the ERP. Why are chemical producers looking inside the plant for capacity? Chemical producers are looking inside the plant because growth no longer covers its inefficiencies. McKinsey’s Chemicals 2025 report found the sector undid 20 years of outperformance in three, as capacity additions outpaced consumption and European producers faced a sustained energy-cost disadvantage. Deloitte’s 2026 Chemical Industry Outlook reports that production growth forecasts fell from 3.5 to 1.9 percent for 2025, with 2 percent expected in 2026, and that margins dropped sharply in 2023 from a 5.8 percent average for 2000 to 2020. Delayed maintenance was among 2025’s cost cuts, protecting this year’s budget at the expense of future capacity. Much of the capacity producers need is already installed. In A new operations formula for the chemicals sector, McKinsey describes a bottleneck monomer furnace that gained 18 to 30 percent in output with an operator app as the only new equipment. For a batch plant, the questions that follow are practical ones: how many good tonnes each bottleneck hour produces, what each tonne truly costs in material, energy and rework, and how much cash is tied up in batches awaiting release. In our experience, many of the answers lie in the time between stages. What is the time between stages in batch chemical production? The time between stages is the time a batch spends waiting or being re-handled between process steps, such as queuing for filtration, drying for longer than planned or waiting for quality release. It is rarely recorded as a step of its own, which is why it is one of the largest and least managed sources of lost throughput in batch chemical production. PVB is best known as the interlayer in laminated safety glass, but its resin grades are also used in printing inks, coatings, adhesives and ceramic binders, and they show the pattern clearly. Making consistent resin requires careful control through reaction, repeated washing, solid-liquid separation, drying, sieving and packing, and a deviation at any one stage changes the work required at the next. A reactor can complete its cycle on time while the batch still misses its plan. Three points in the route tend to account for most of the waiting: Before filtration, where material queues for the filter and the queue itself is rarely recorded as a step in its own right. In the dryer, where wet cake can arrive with a different moisture load or charge mass than planned and extend the drying cycle beyond the schedule. On hold before release, where laboratory results, charge records and process conditions are gathered manually into a single release decision. Each of these delays has a different cause and calls for a different response. When drying runs long, comparing incoming wet-cake moisture and charge mass with filtration duration, wash history and the dryer’s operating profile lets production, quality and maintenance investigate the same batch from a shared history, without reconciling separate records. Why does the time between stages go unmanaged? The time between stages goes unmanaged because the people closest to it handle it through experience, and their adjustments never reach the batch record. Across the plants we work with, similar adjustments appear again and again. A dryer operator extends the cycle when the cake feels wetter than usual, while the schedule continues to assume the standard cycle time. A team lead gives batches from one water source an additional wash because of a past quality issue, although the approved route contains no such step. A planner adds a day to every release date for a particular grade because its laboratory results consistently take longer. Each of these adjustments is sensible, and the plant runs better because of them. The difficulty is that the batch record captures only the outcome, a longer cycle or a later release, and none of the reasoning behind it. This exposure is growing: in Germany alone, 20 to 30 percent of the workforce is expected to retire by 2030, according to Federal Employment Agency figures cited by McKinsey, and each departure removes some of this knowledge unless it has been recorded. What do disconnected operations cost a chemical plant? Disconnected operations cost a chemical plant in three places: margin, saleable capacity and working capital. The table below sets out where these exposures typically arise. Challenge Operational Consequence Financial Impact Manual charge recording, additions and phase execution Records depend on operator input; deviations take longer to reconstruct and investigate. Margin: extra recording and investigation effort; rework and material losses when errors occur. Capacity: rework occupies equipment needed for planned batches. Limited visibility of utility consumption Batch-level energy and water use is difficult to compare; inefficient conditions can remain undetected. Margin: excess utility costs stay hidden within overall plant costs, obscuring the true cost per good tonne and batch profitability. Disconnected filtration and drying data Wet-cake condition, charge mass and dryer performance are not assessed together; cycle-time variation is harder to explain. Capacity: longer cycles at the bottleneck limit saleable tonnes. Margin: lower output raises fixed cost per tonne; unmet demand can mean lost contribution. Fragmented quality evidence and batch release Batches remain on hold while records are